Debugging ISLE Local with PHPStorm
For the past couple of years I’ve been working in Digital.Grinnell to remove as much “customization” as I can. The effort is coming along, but still, there’s a long way to go. Every now and then I come across a feature that we just can’t live without, and it’s in times like those that I turn to PHPStorm for development and testing. Unfortunately, I’ve been operating without PHPStorm in ISLE because I worried that configuring the PHPStorm debugger in a Docker environment would be a time-consuming, tall task. It was tricky, but worry no more!
The Goal
Simple: Get PHPStorm configured with ISLE and my http://dg.localdomain development instance of Digital.Grinnell, with real-time debugging. I do my development on any one of three Mac’s, so making things work in an OS X environment was also a requirement. I searched, seemingly for days, through a host of blog posts, tutorials, and documents, for any applicable guidance that might get me to my goal. There is LOTS of advice and guidance available, but in many cases it’s for a very specific environment, or written strictly from a “How I Did It” perspective, with little or no explanation of “why” certain things were done.
This post is another “How I Did It” account, but the resources I used include some welcome explanations.
The Resources
There was one key document that I came to rely on: Turbocharged PHP Development with Xdebug, Docker & PHPStorm, a dev.to blog post by James Seconde. Thank you, James! Excellent work, and thank you for sharing!
The other document that’s still open in my browser is Create a local server configuration, part of JetBrains’ documentation suite. This document is linked in from James’ post too.
A Summary of Changes
dg-isle is my Digital.Grinnell copy of the project repository identifed as yourprojectnamehere-isle in the ISLE documentation. All of my changes were made in that repo, and they are summarized in the following git status result:
╭─mark@Marks-Mac-Mini ~/ISLE/dg-isle ‹main*›
╰─$ git status
On branch main
Your branch is up to date with 'origin/main'.

Changes not staged for commit:
  (use "git add <file>..." to update what will be committed)
  (use "git checkout -- <file>..." to discard changes in working directory)

	modified:   docker-compose.local.yml
	modified:   local.env

Untracked files:
  (use "git add <file>..." to include in what will be committed)

	xdebug-local.ini

no changes added to commit (use "git add" and/or "git commit -a")
Contents of Those Files
docker-compose.local.yml
In docker-compose.local.yml I added only the last line you see below, in the volumes: portion of the apache: container config.
apache:
  image: islandoracollabgroup/isle-apache:1.5.4
  ...lines removed for clarity...
  volumes:
    # Customization: Bind mounting Drupal Code instead of using default Docker volumes for local development with an IDE.
    - ~/ISLE/dg-islandora:/var/www/html:cached
    ...lines removed for clarity...
    - ./xdebug-local.ini:/etc/php/7.1/apache2/conf.d/20-xdebug-local.ini
Attention! While the line I added above does work, it’s a bit of a brute force approach and is probably not sustainable. I’ve found a much better approach is to inject my debug config like so:
apache:
  image: islandoracollabgroup/isle-apache:1.5.4
  ...lines removed for clarity...
  volumes:
    # Customization: Bind mounting Drupal Code instead of using default Docker volumes for local development with an IDE.
    - ~/ISLE/dg-islandora:/var/www/html:cached
    ...lines removed for clarity...
    - ./xdebug-local.ini:/etc/php/7.1/mods-available/xdebug.ini
local.env and .env
In local.env I added a comment followed by three lines of configuration, all near the top of the file, like so:
## ISLE Local
## This local.env file is used with / for the docker-compose.local.yml

## Windows user should uncomment the following line:
# COMPOSE_CONVERT_WINDOWS_PATHS=1

## Parameters for XDEBUG and PHPStorm
ENABLE_XDEBUG=true
PHP_MEMORY_LIMIT='128M'
PHP_IDE_CONFIG='serverName=dg_local'
...remaining lines removed for clarity...
Note that dg_local above is the same as the COMPOSE_PROJECT_NAME parameter from my .env file. The contents of .env remains unchanged:
#### Activated ISLE environment
# To use an environment other than the default Demo, please change values below
# from the default Demo to one of the following: Local, Test, Staging or Production
# For more information, consult https://islandora-collaboration-group.github.io/ISLE/install/install-environments/

COMPOSE_PROJECT_NAME=dg_local
BASE_DOMAIN=dg.localdomain
CONTAINER_SHORT_ID=ld
COMPOSE_FILE=docker-compose.local.yml
xdebug-local.ini
This is a new file, one not previously found in the ISLE configuration. James mapped this file into his configuration like so:
- ./xdebug-local.ini:/usr/local/etc/php/conf.d/xdebug-local.ini
Don’t use that in ISLE! The correct config for ISLE is the line I added to docker-compose.local.yml which reads:
- ./xdebug-local.ini:/etc/php/7.1/apache2/mods-available/xdebug.ini
The ./ prefix in that line dictates that your xdebug-local.ini file should be in your project’s root directory, the same directory where docker-compose.local.yml resides. In my case that’s ~/ISLE/dg-isle.
The contents of your xdebug-local.ini file, assuming you’re using OS X, should be identical to James’ copy, and mine:
zend_extension=xdebug
xdebug.remote_enable=1
xdebug.remote_autostart=1
xdebug.remote_port=9001
xdebug.remote_host=host.docker.internal
How I Did It
To be honest, I tried so many things, I am not absolutely certain which parts were necessary, and which were not. So, let me just explain what I did in each of the steps that James outlined.
Step One: Installing Xdebug
I did NOT create a newDockerfileor new build of ISLE’s Apache container. All that was required in that regard, I believe, was the inclusion of theENABLE_XDEBUG=trueline inlocal.env.Step Two: Configuring Xdebug
I followed James’ guidance explicitly here. Please read his post!Step Three: Inject Config to Docker
Again, I followed James explicitly, but omitted theDB_parameters since I’m only interested in debugging PHP code. As James suggests, theserverNameparameter inPHP_IDE_CONFIG:is critical.Step Four: Set up PHPStorm
This is where things got a bit confusing, so I’ll dispense with my recollection and just show you my end results in a series of screen grabs. Please DO give James’ post a good read though, there’s lots of helpful explanation within.
My Project Structure
Locally, my ISLE configuration and code live in a pair of repositories named dg-isle and dg-islandora inside an ~/ISLE directory. That ~/ISLE directory now includes a .idea hidden folder, and that’s where all of my associated PHPStorm project info lives. It all looks like this:
╭─mark@Marks-Mac-Mini ~/ISLE
╰─$ ls -alh
total 16
drwxr-xr-x    6 mark  staff   192B Mar 11 13:08 .
drwxrwxr-x+ 137 mark  staff   4.3K Mar 12 12:18 ..
drwxr-xr-x   13 mark  staff   416B Mar 12 12:14 .idea
drwxr-x---@  36 mark  staff   1.1K Mar 11 14:18 dg-islandora
drwxr-xr-x   42 mark  staff   1.3K Mar 11 12:41 dg-isle
First Steps in PHPStorm
The first thing I remember doing in PHPStorm was creating my project. That process is probably best shown in this screen grab:
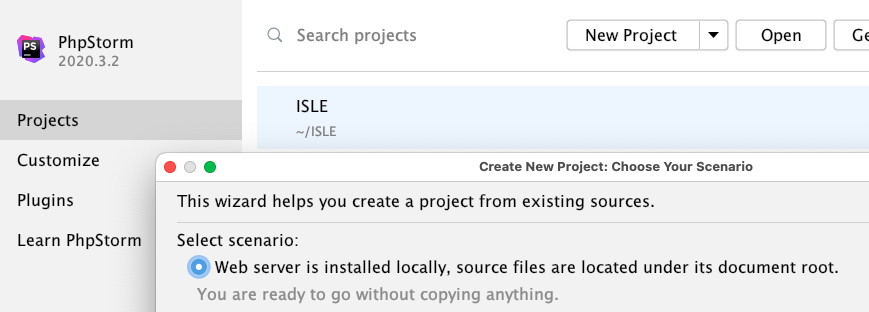
I used the New Project button and New Project from Existing Files... pull-down option to get started. Be sure to choose the Web server is installed locally... scenario too.
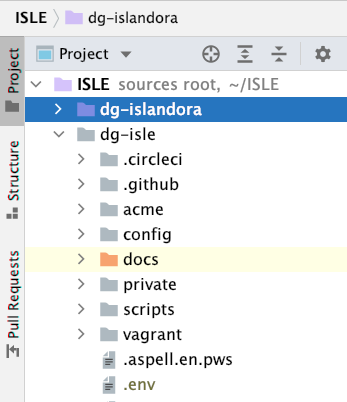
The resulting structure can be seen in this screen grab showing the upper-left corner of my PHPStorm application window.
Next Steps
This is where things really get foggy, so, more screen grabs showing the results.
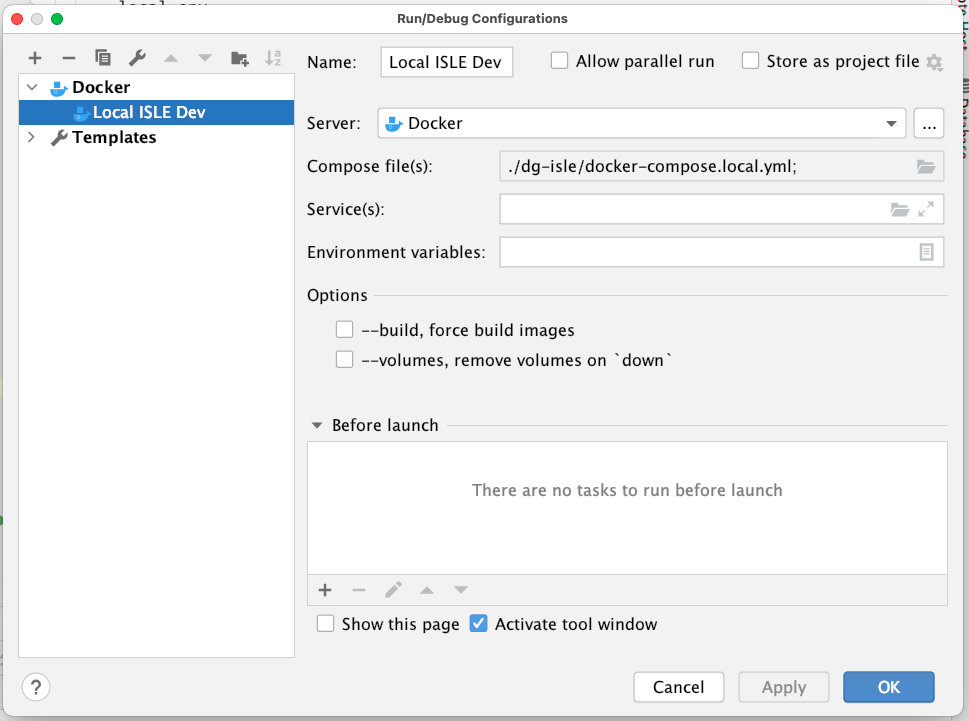
My Run/Debug Configurations look like this:
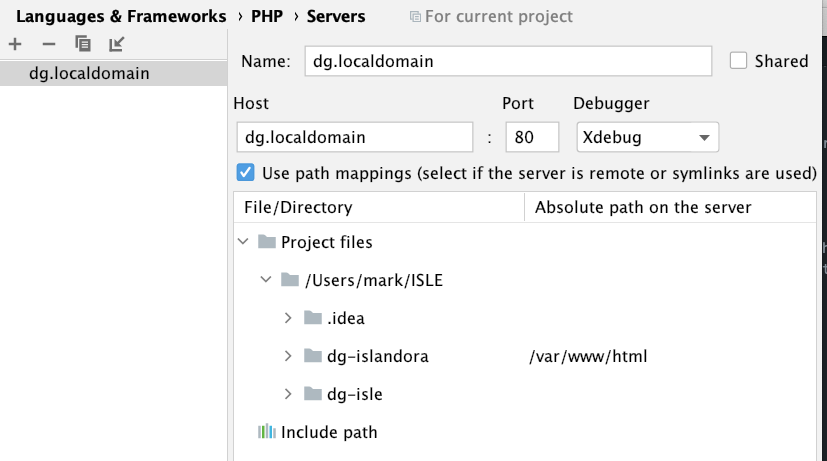
My Preferences > Language & Frameworks > PHP > Servers configuration looks like this:
Please don’t ask me to recall exactly how I created those configurations. Here’s what I do remember…
Let the Magic Happen
The final pieces of this puzzle just seem to “magically” fall into place once you begin your first debugging session. In my case, after configuring most of what you’ve seen above, I did this:
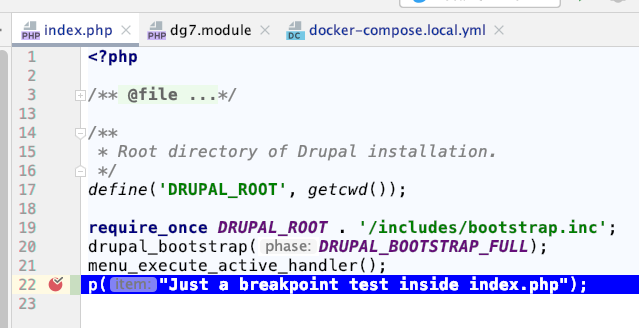
Opened PHPStorm to the
ISLEproject.Opened
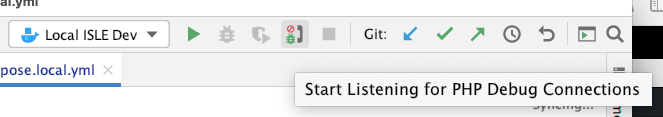
index.phpand set a breakpoint. I also elected to add a simple print statement like you see below.Toggled the “Start Listening” button (the button with the phone and red circle) in the included image.
Opened my local ISLE instance,
http://dg.localdomain, in the browser of my choice, Firefox, and clickedRefresh. The first time I did this with PHPStorm “listening”, I was prompted with some “connection” follow-up questions. That happens only once, and the questions are not too difficult to answer.Enjoyed debugging ISLE without a single
var_dump()orprint_r()statement!
But What About Debugging in Drush?
I have a number of PHP scripts implemented in drush as part of a Drupal module I call idu, and I need to be able to debug those too. But the above configuration doesn’t work properly with drush commands. So, what’s missing?
After considerable searching I found two critical changes were necessary…
Export the serverName Config
Before making any drush-specific configruation changes I was seeing messages like this in PHPStorm when attempting to debug a script:
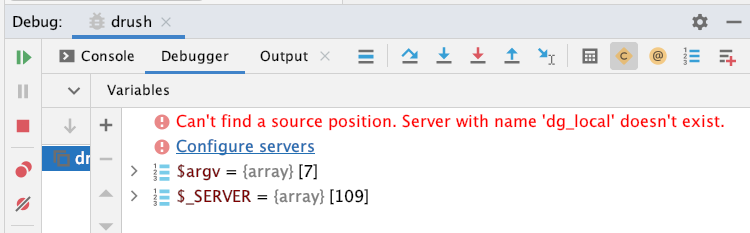
Turns out for cli debugging you have to explicitly “export” the PHP_IDE_CONFIG value inside the running container, like so:
root@7793f5d333fd:/var/www/html/sites/default# export PHP_IDE_CONFIG="serverName=dg_local"
But, hold on, that’s still not right! The dg_local server isn’t what I want for cli debugging. For that I have a PHPStorm server named apache that was automatically created for me. So the command I need to run in the container is:
root@7793f5d333fd:/var/www/html/sites/default# export PHP_IDE_CONFIG="serverName=apache"
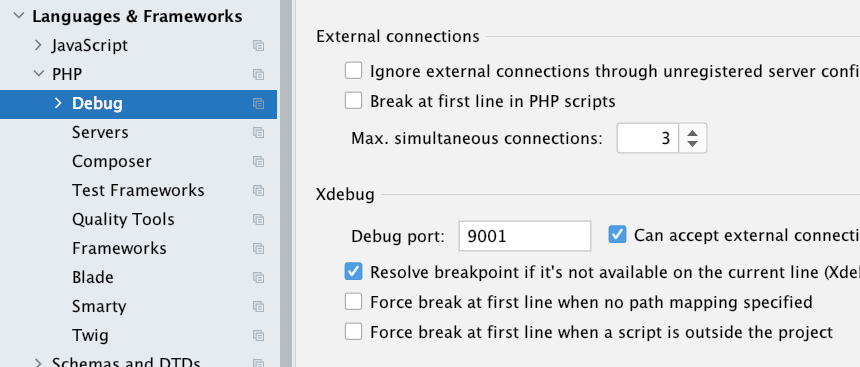
Don’t Use Automatic Breakpoints!
In my configuration, drush lives in my Apache container at ./opt/drush-8.x/vendor/drush/drush/drush, but the source code I mapped to PHPStorm only includes the directories and file that live in and below /var/www/html. So, if you leave automatic breakpoints turned on in PHPStorm and run drush, the debugger will stop in a location that you can’t “see”, making it nearly impossible to step through your code.
The fix for this is to turn OFF the last two PHPStorm preferences checkboxes you see below. Turning those off will ensure that PHPStorm does not stop execution at the first line inside the Apache containers drush command script.
And that’s a wrap. Until next time, happy debugging!